Monitoring vs Observability: What’s the difference?
In this article, we are discussing how so similar-sounding terms like monitoring and observability differ of Monitoring vs Observability
How is monitoring different from observability?
Bugs and errors are inevitable even with the most experienced developers and tools on the team. Finding and resolving these bugs is a major part of the development process. But the problem comes when customers find these bugs first. Because then they might give a bad ‘public’ review or worse, switch to a competitor never to return again.
However, this unfortunate situation can be avoided if the developers find these bugs first and fix them before the customers face them. But how?
Here comes monitoring and observability tools that help developers detect and fix errors and anomalies across the system. They may sound similar, but monitoring and observability are quite different based on their functionality and scope of work.
Let’s first understand what is monitoring…
Table of Contents
What is monitoring?
Monitoring refers to continuously collecting and analyzing data on performance, availability, and system health in general. It measures specific metrics like CPU usage, uptime/downtime, response time, error rates, etc.
SRE(Site Reliability Engineering) developed by Google is the practice of combining software engineering and operations to automate tasks and ensure system reliability. Dynatrace describes it as “As a discipline, SRE focuses on improving software system reliability across key categories including availability, performance, latency, efficiency, capacity, and incident response.” SRE practices involve monitoring of some the most important metrics known as the 4 golden signals. They are described as follows:
- Latency: It is the time taken by a system to respond to a request. For example, the time it takes for a website to load when the user clicks on its link. If the latency is more i.e. the website takes more time to load, it annoys the user who might abandon it. Thus, the lower the latency, the better the user experience.
- Traffic: Traffic measures the amount of load a service or system is handling at a time. A higher traffic indicates higher user demand for the service.
- Error: The error rate is the rate of unsuccessful or failed requests. It is important to track both the overall error rate and the service-specific error rate. Categorizing errors into critical and non-critical also helps the development team deal with the most disruptive errors first.
- Saturation: Saturation tells you about the overall capacity of a service or how close a service is to reaching its limits. It is measured in terms of how much CPU, memory, or network bandwidth the service is utilizing.
Application performance monitoring or APM is another term related to monitoring that focuses on tracking the performance of applications in particular. Some popular monitoring tools include Nagios, Zabbix and Prometheus.
What is observability?
Strongdm defines observability, also known as O11Y, as “the ability to assess an internal system’s state based on the data it produces.”
Unlike monitoring, which barely collects data as fixed metrics, observability involves analyzing current and historical data and helps to diagnose the root cause of errors in the system. That said, although observability has a wider scope than monitoring, it cannot function without it.
The 3 pillars of observability through which it determines system health are – logs, metrics, and traces…
- Metrics: Metrics are quantitative (or numerical) measures of data that indicate the system’s health and performance. It is the place where observability overlaps with monitoring. Error rate, CPU utilization, and network throughput are a few examples of metrics.
- Logs: SolarWinds defines logs as “…detailed records of events from every piece of software, user action, and network activity.” They include time-stamped and chronological data on all the processes that occur within a service. That said, while metrics raise alerts during a problem, logs tell about what events happened and are happening around the problem. This helps the developers find the cause of the problem.
- Traces: Traces record the flow of a request from one end to the other. They help developers see the flow of requests and identify errors in their path.
Observability tools help to gather and analyze data like metrics, logs, and traces to diagnose issues in the system. AppDynamics, Datadog and Dynatrace are a few of the leading observability tools in the market.
Monitoring vs observability
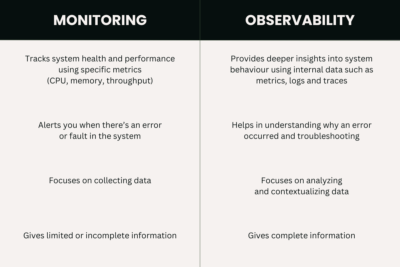
Here’s a table for a quick summary of the difference between monitoring and observability…

Conclusion
Monitoring and observability perform similar functions but differ in terms of the depth of work. Monitoring provides surface-level insights like what the problem is while observability provides deeper insights into what caused the problem and how it is affecting the system. Moreover, observability tools can include monitoring features but it is not so the other way around. Hence, monitoring can be said as a part of a larger and advanced field which is observability.


