


What are DORA Metrics?
We have already discussed about DevOps culture and a few metrics and KPIs before. In today’s article, we will be focusing on 4 standard metrics provided by DORA and how to improve them.
What are DORA Metrics in DevOps & How to Improve Them?
The aim of DevOps is to improve the software development process through better communication and collaboration between the development and operations teams. DevOps culture has four basic principles as per the CAMS model:
- Culture
- Automation
- Measurement
- Sharing
The third principle, that is measurement, is what entails the metrics and Key Performance Indicators (KPIs) used to evaluate the DevOps performance of companies. These metrics and KPIs also help companies find loopholes in their development and deployment process. There are several metrics and KPIs, but four of them have been set as standard by DORA.
Let’s see what is DORA and it’s 4 standard metrics…
What are DORA Metrics?
DevOps Research and Assessment (DORA) is a research program launched by Gene Kim, Jez Humble, and Dr. Nicole Forsgren. It is a team at Google Cloud that “seeks to understand the capabilities that drive software delivery and operations performance.” (DORA)With years of research, DORA has identified 4 key metrics that help to measure the DevOps performance of businesses. These key metrics can be categorized based on what they measure.
The first category measures the throughput (or velocity) which refers to how fast changes are being made. It includes:
- Deployment frequency
- Lead time for changes
The second one measures stability which refers to the quality of the changes and the ability of the team to fix any failures. It includes:
- Change failure rate
- Mean time to recovery
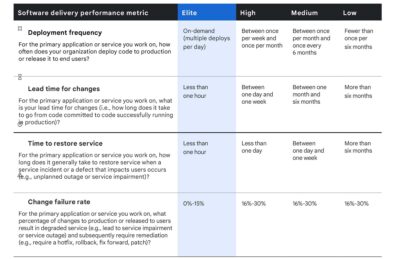
Based on these metrics, DORA classifies the DevOps performance of companies into four: Elite, High, Medium and Low. After understanding all the metrics, you can also attempt the DORA Quick Check to evaluate these metrics for your company.
So let’s discuss each one of the metrics and how to improve them one by one…
Deployment frequency
Deployment frequency tells how often new codes are deployed to production. It can be simply calculated by counting the number of codes deployed over a period of time. It can range from multiple times a day (for high-performing teams) to once every 6 months or more (for low-performing teams).
How to improve deployment frequency?
- Smaller deployments: When you receive a proposal for change, try to break it down into smaller changes. This makes it look less intimidating and more doable. Moreover, it becomes easy to test with smaller changes and rollback in case of failures.
- Automation: Automating manual or repetitive tasks like testing or deploying can help reduce time spent on individual deployments. This allows the workforce to focus on more creative and complex tasks instead, thus improving the frequency of updates.
Change lead time
Change lead time or the lead time for changes indicates the efficiency of the CI/CD pipeline based on how much time it takes for a change to get successfully deployed to production. In other words, it is “the difference in hours between the date and time of the author’s commit and the date and time of the deployment containing that commit.” (Pluralsight)
It can range from less than an hour (for high-performing teams) to more than 6 months (for low-performing teams).
How to reduce change lead time?
- Smaller deployments and automation: As said before, smaller batches of codes and automated testing and deployment help speed up the deployment process and reduce change lead time.
- Optimize communication: Smooth communication and collaboration help in faster decisions and less delays.
Change failure rate
Change failure percentage or change failure rate (CFR) is the percentage of deployments that lead to failures in production. A ‘change failure’ means any negative impact like crashes, low performance, or security vulnerabilities caused by a change or update. It can be calculated using the following formula:
CFR = (number of failed changes/total number of changes)*100
A CFR lower than 15% is considered good while anywhere between 16 to 30% is considered high. A lower CFR indicates a reliable CI/CD pipeline and effective testing.
How to reduce the change failure rate?
- Automated testing: Test automation and code reviewing at every step help to ensure the correctness of codes and reduce human errors.
Mean time to restore service (MTTR)
Also known as failed deployment recovery time, MTTR is the time taken to recover from a partial service interruption or a total failure. It includes the time spent diagnosing and repairing the issue and redeploying the new code. It can be calculated using the following formula:
MTTR = (Total downtime/Number of incidents)*100
It ranges from less than an hour (for high-performing teams) to 6 months (for low-performing teams).
How to reduce MTTR?
- Real-time monitoring and alerting systems: Continuous monitoring helps to instantly detect anomalies and resolve them quickly.
- Automation: Use automation tools for detecting and resolving faults speedily.
- Improve communication: Improve communication between teams to reduce delays and keep everyone updated.
- Infrastructure as Code (IaC): IaC improves collaboration and allows easy rollback mechanisms in case the new code does not work.
The above metrics can be summarized using the table given below:

Other Important Metrics & KPIs
- Change volume: Change volume measures the amount of changed code against the static (old) code. It helps to determine how impactful the deployed codes are.
- Defect escape rate: It measures how frequently defects go unnoticed and escape into production. It indicates the quality of the development and testing processes.
- Time to detection: Time to detection, as the name suggests, is the time taken to detect failures. A lower time to detection means effective monitoring and alerting mechanisms.
- Deployment success & failure rate: Deployment success rate is the percentage of deployments that do not require rollbacks or hotfixes while deployment failure rate includes those that result in errors.
- Customer ticket volume: It is the total number of tickets or alerts raised by the customers.
Conclusion
Measuring your performance is the key to improving it. The four DORA metrics – deployment frequency, change lead time, change failure rate, and mean time to recover – help to quantitatively measure the current performance of your DevOps team. These metrics can be improved mostly through automation and smooth collaboration between teams. Continuous assessment and improvement of these metrics ultimately help to improve customer satisfaction – the goal of all businesses and companies.